GWAS & Mendelian Randomization
参考
TARGET
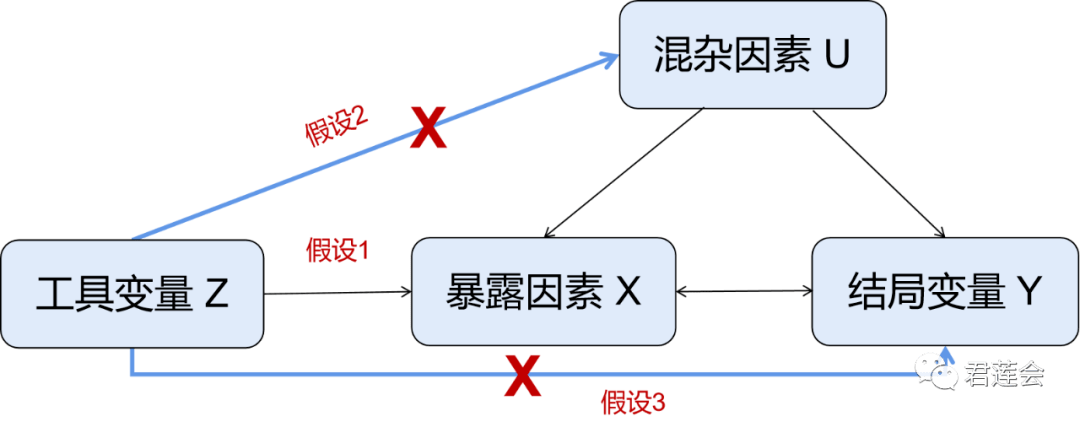
利用PLINK进行GWAS研究,找出遗传区域和性状/疾病之间的关联,从而找出与暴露因素存在直接关联,与混杂因素和结果没有关系的工具变量
采用遗传位点作为分析工具的最主要原因——不可改变性。遗传位点在受精时就已经确定。

基因型(工具变量)还需要满足以下条件:
工具变量这个概念居然是最先在计量经济学中发生应用的orz
工具变量(基因型)需要与暴露因素X(表型)强相关(假设1,关联性假设,相关系数>0.8)。如果使用弱工具变量,所得结果容易出现偏倚。
工具变量不能与其它任何可能的混杂因素相关(假设2,独立性假设)。例如:性别、年龄、体重等用于人群分层的因素需要剔除。
工具变量(基因型)不能与结果直接相关(假设3,排他性限制,工具变量只可以通过暴露因素影响结局)。其他可能影响因素的包括多效性等。
其他假设:不存在选型交配。
CONCEPTS
SNP
Single-Nucleotide Polymorphism
DNA序列中单个核苷酸的替代导致的、且分布于种群中相当一部分个体(如:1%以上)中的基因多样性。例如,对于某种生物,同一位置基因组片段一部分为AAGCCTA,另一部分为AAGCTTA,则认为此处存在SNP、两种基因型属于等位基因。
文件类型
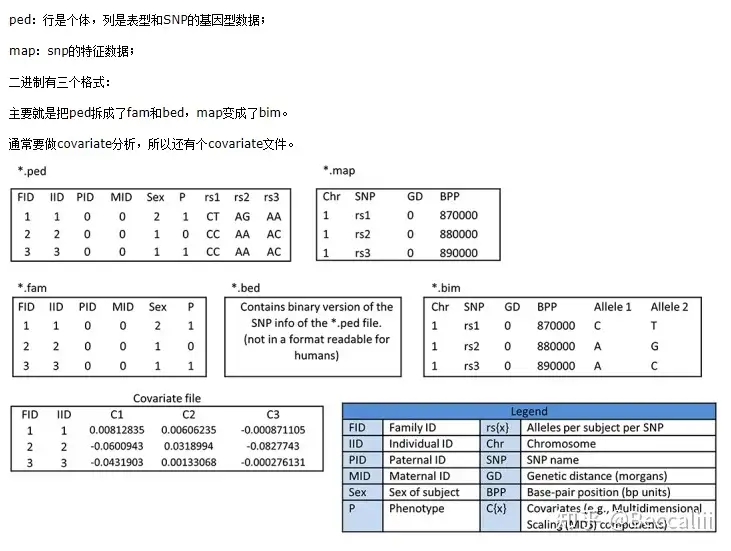
.ped files
The PED file is a white-space (space or tab) delimited file: the first six columns are mandatory:
Family ID
Individual ID
Paternal ID
Maternal ID
Sex (1=male; 2=female; other=unknown)
Phenotype
A PED file must have 1 and only 1 phenotype in the sixth column. The phenotype can be either a quantitative trait or an affection status column
Genotypes (column 7 onwards) should also be white-space delimited; they can be any character (e.g. 1,2,3,4 or A,C,G,T or anything else) except 0 which is, by default, the missing genotype character. All markers should be biallelic. All SNPs (whether haploid or not) must have two alleles specified. Either Both alleles should be missing (i.e. 0) or neither. No header row should be given. For example, here are two individuals typed for 3 SNPs (one row = one person):
.map files
By default, each line of the MAP file describes a single marker and must contain exactly 4 columns:
chromosome (1-22, X, Y or 0 if unplaced)
rs# or snp identifier
Genetic distance (morgans)
Base-pair position (bp units)
--map3可以去除Genetic distance
.frq
CHR Chromosome
SNP SNP identifier
A1 Allele 1 code (minor allele)
A2 Allele 2 code (major allele)
MAF Minor allele frequency
NCHROBS Non-missing allele count
.assoc
CHR Chromosome
SNP SNP ID
BP Physical position (base-pair)
A1 Minor allele name (based on whole sample)
F_A Frequency of this allele in cases
F_U Frequency of this allele in controls
A2 Major allele name
CHISQ Basic allelic test chi-square (1df)
P Asymptotic p-value for this test
OR Estimated odds ratio (for A1, i.e. A2 is reference)
.model
CHR Chromosome number
SNP SNP identifier
TEST Type of test
AFF Genotypes/alleles in cases
UNAFF Genotypes/alleles in controls
CHISQ Chi-squated statistic
DF Degrees of freedom for test
P Asymptotic p-value
MAF
MAF: 最小等位基因频率
最小等位基因频率怎么计算?比如一个位点有AA或者AT或者TT,那么就可以计算A的基因频率和T的基因频率,qA + qT = 1,这里谁比较小,谁就是最小等位基因频率,比如qA = 0.3, qT = 0.7, 那么这个位点的MAF为0.3. 之所以用这个过滤标准,是因为MAF如果非常小,比如低于0.02,那么意味着大部分位点都是相同的基因型,这些位点贡献的信息非常少,增加假阳性。更有甚者MAF为0,那就是所有位点只有一种基因型,这些位点没有贡献信息,放在计算中增加计算量,没有意义,所以要根据MAF进行过滤。
GWAS
- Genome-wide association studies
- 用于识别遗传区域(基因组)和性状/疾病之间关联的方法。

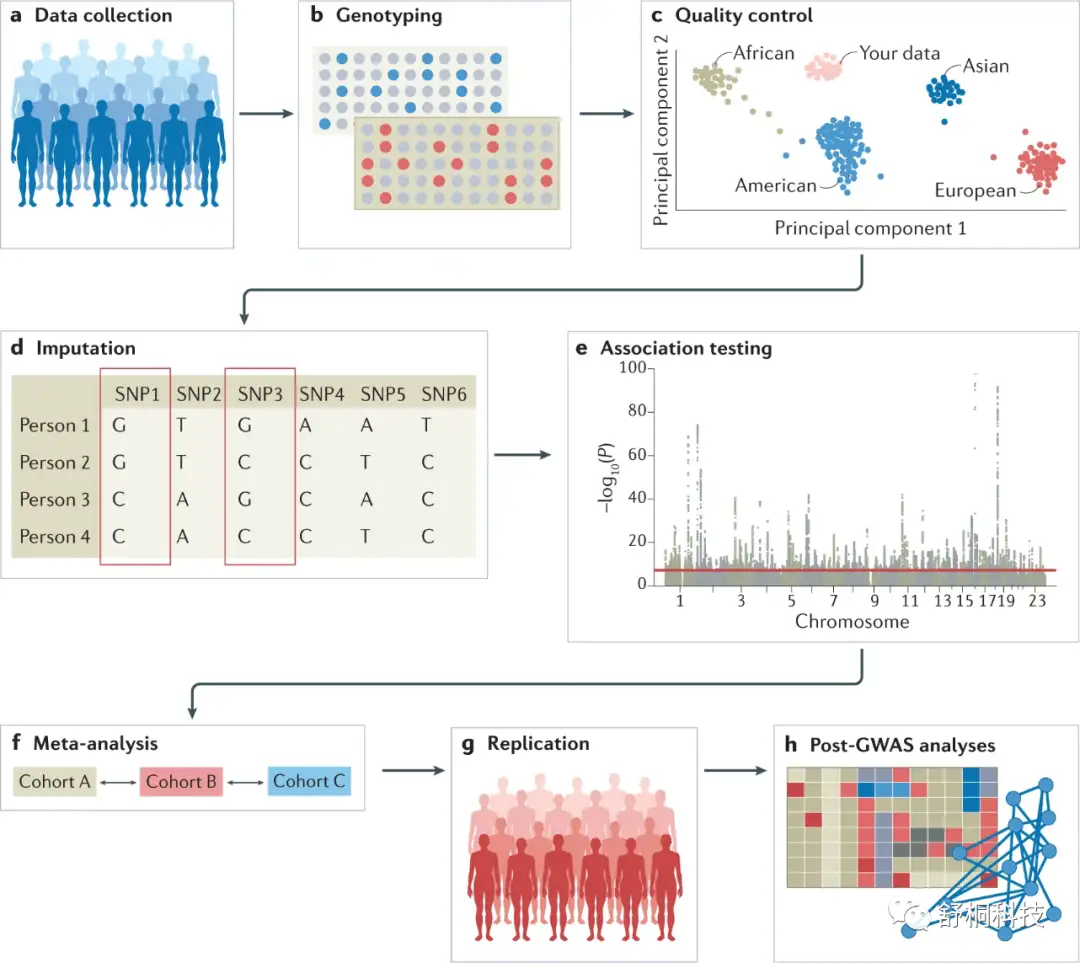
基本步骤
- 从一组受试者中收集其DNA和表型信息(如患病情况以及年龄、性别等人口统计学信息)
GWAS通常需要非常大的样本量来确定可被复现的全基因组显著关联,研究者可以使用CaTS或GPC等工具中的功效分析功能来所需的样本量。研究所关注的表型可以是二分类的病例-对照类型,也可以是定量测量的性状。
- 基因分型
目前,对个体进行基因分型的方法主要包括微型阵列(针对常见变异)和下一代测序技术(如WES、WGS等,可用于研究稀有变异)。较长一段时间以来,由于NGS的成本较高,基于微阵列的基因分型技术往往是GWAS研究中更为常用的选择。当然,理想情况下,与WES和微阵列相比,WGS理应是基因分型的首选办法,因为它几乎能够鉴定全基因组范围内的每个基因型,而随着该技术的日益普及,WGS有望在未来成为主流选择。
- 质量控制与数据清洗
GWAS分析所需要的数据包括匿名的个体ID、个体间的家庭关系信息、性别、表型、协变量、全基因组的基因分型信息以及基因分型的批次信息等。对上述的输入数据进行严格的质量控制,是后续GWAS分析得到可靠结果的前提。通常来说,GWAS的数据清洗和质控流程主要包括:去除稀有变异、过滤不处于哈温平衡(Hardy–Weinberg equilibrium)的位点、去除个体缺失率较高的位点、识别并去除基因分型的错误、控制人群分层等。
在对GWAS阵列数据进行样本和变异位点的质量控制后,通常需要进一步开展人群phasing,并基于单倍型参考序列集(reference panel)进行基因型推断(imputation)。在这一环节中,常见的参考序列集可来自千人基因组计划或TOPMed项目。
此外,血统和亲缘关系也是GWAS质量控制流程中的一个重要考虑因素,特别是对于纳入了多个不同背景的参与者的数据集来说,这是为了避免由于人群分层而产生的假阳性遗传信号以及偏倚的关联统计量。在GWAS研究中,通常采用主成分分析的方法,首先基于所有个体的基因型数据来划分具有相似遗传信息的群体,然后将基因型主成分作为协变量纳入到后续的回归模型中,从而校正人群分层。
- 开展关联统计检验
在当前步骤中,对于连续型表型(如身高、血压、BMI等)和二分类表型(如是否患病),我们分别采用线性回归和logistic回归模型来检验相关性。同时,为了避免人群分层和其他人口统计学因素所带来的混杂影响,需要纳入诸如年龄、性别、主成分等协变量对回归模型进行校正。此外,线性和logistic混合模型(可利用fastGWAS等工具实现)额外纳入了亲缘关系作为随机效应项,既能提高关联统计检验的效力,还能有效控制人群分层。
- 开展GWAS荟萃分析
结合多个队列的GWAS汇总统计结果,Meta分析可以基于固定效应模型或随机效应模型来检验异质性(例如检测某个队列的关联结果是否偏离于其他队列),并根据样本量大小,通过逆方差法对每个独立人群的结果进行加权,最终计算出一个更为准确的、综合的关联效应量。
- 在独立验证人群中复现关联结果
在GWAS研究中,比较发现队列和独立验证队列之间的关联效应量往往是确定可靠的“变异-表型“关联的金标准。需要注意的是,验证队列必须完全独立于发现队列,即两个队列间不能存在共有的个体或亲缘上的关系。
- 开展各类后续分析来对GWAS结果进行解释(可选)
Manhattan Plot
A Manhattan plot is a type of plot, usually used to display data with a large number of data-points, many of non-zero amplitude, and with a distribution of higher-magnitude values. The plot is commonly used in genome-wide association studies (GWAS) to display significant SNPs.
在 GWAS 曼哈顿图中,基因组坐标沿 x 轴显示,每个单核苷酸多态性 (SNP) 的关联 p 值的负对数显示在 y 轴上,这意味着曼哈顿图上的每个点表示一个单核苷酸多态性。由于最强的关联具有最小的 p 值(例如 10 −15 ),因此它们的负对数将是最大的(例如 15)。每个块的不同颜色通常显示每个染色体的范围。
关联性强的SNP的P_值会比较的小,从而像Manhattan里的摩天大楼高耸入云。
还是没看懂为什么需要作这个Manhattan Plot
PLINK
- GWAS分析工具
Commands
Preparation
按照知乎的教程,先是下载下载下来example.zip
1 | # 下载测试数据,进入目录环境 |
--file读取.ped和.map文件--make-bed指令可以得到.ped和.map文件的二进制格式(按照官方的说法,二进制读取大文件更快更稳定一点)- Make
.bed,.famand.bim
- Make
--out {plink}Specify output root filename

QC
1 | # 样本缺失率和位点缺失率过滤 |
--bfile {plink}Specify.bed,.famand.bim--missingReporting summary statistics -> Missing rates (per individual, per SNP).imss是 Missing rates, per individual.lmiss是 Missing rates, per locus(基因座)
- missing individuals (N MISS) and the proportion of individuals missing (F MISS)
MAF计算
1 | # MAF 计算 |
这段代码有一点点复杂orz
--freq等位基因频率表,.frq- cut 分割 | sort 排序 | uniq 去重
--withinStratify frequencies and missing rates by clusters- 要生成按分类聚类变量分层的等位基因频率摘要,请使用
--within 文件名选项以及--missing。这样,将分别给出分类变量的每个级别的频率。 - 按照
pop.cov的聚类结果计算frequencies和missing_rate
- 要生成按分类聚类变量分层的等位基因频率摘要,请使用
PCA 主成分分析
为什么要进行PCA?
GWAS研究时经常碰到群体分层的现象,即该群体的祖先来源多样性,我们知道的,不同群体SNP频率不一样,导致后面做关联分析的时候可能出现假阳性位点(不一定是显著信号位点与该表型有关,可能是与群体SNP频率差异有关),因此我们需要在关联分析前对该群体做PCA分析,随后将PCA结果作为协变量加入关联分析中。
1 | $ plink --bfile wgas1 --pca 10 --out wgas1_pca |
为什么没有在Command Table中找到
--pca这个选项orz
关联分析
- 查看每个为点和表型的关联度
分布 - 输出
*.assoc - Basic case/control association test
1 | $ plink --bfile wgas1 --assoc --out as1 |
细化分析
Cochran-Armitage 趋势检验要求一个变量是有序分类变量,另一个变量是二分类变量(此处可看为case组和control组),常用来说明某一事件发生率是否随着原因变量的变化而呈线性趋势。
Cochran-Armitage检验
参见 Cochran–Armitage test for trend
- is used in categorical data analysis when the aim is to assess for the presence of an association between a variable with two categories and an ordinal variable with k categories.
t
1 | # model 的模式,一次性进行多项检验 |
- 这里的
--model专指这个 Cochran-Armitage检验
分层分析
- IBS聚类
- complete linkage agglomerative clustering, based on pairwise identity-by-state (IBS) distance, but with some modifications to the clustering process: restrictions based on a significance test for whether two individuals belong to the same population (i.e.
do not merge clusters that contain significantly different individuals) , a phenotype criterion (i.e. all pairs must contain at least one case and one control) and cluster size restrictions (i.e.
such that, with a cluster size of 2, for example, the subsequent association test would implicitly match every case with its nearest control, as long as the case and control do not show evidence of belonging to different populations).
1 | # --mc 2 意思是两两成对 -ppc 设定pvalue的阈值 |
关联分析-分组
Cochran-Mentel-Haenszel (CMH) association statistics
- a test used in the analysis of stratified or matched categorical data. It allows an investigator to test the association between a binary predictor or treatment and a binary outcome such as case or control status while taking into account the stratification.
1 | # --mh approach is no longer available (this applies only to case/control samples) |
一些感想
按照知乎的教程学完了…感觉学习了很多东西,但是又好像什么都没学orz
熟练了bash操作
可能还是得在实际应用中对照着Command Doc来进一步熟练
- Title: GWAS & Mendelian Randomization
- Author: Yuze-L
- Created at : 2024-02-04 00:03:09
- Updated at : 2025-06-28 23:30:35
- Link: https://yuze-l.github.io/2024/02/04/GWAS/
- License: This work is licensed under CC BY-NC-SA 4.0.
